Multidimensional Vapour Diffusion
Computational description of vapour diffusion in building constructions can provide valuable hints for answering the questions if there is a risk of, potentially destructive, interstitial vapour condensation within the core of the construction or not (Interstitial Condensation Assessment).
Diffusion equations have the same structure as those describing heat transfer and can be solved analytically only for one dimensional vapour diffusion. In all higher dimensional cases numerical methods, like the one implemented in AnTherm, have to be used.
| VAPOUR-option: Analysis of multidimensional vapour diffusion is only possible with an active VAPOUR-Option of the program.. |
 |
AnTherm calculates two- and three-dimensional distribution of vapour partial pressures in building constructions.
Saturation pressure distribution within the construction is computed too - based on the temperature distribution.
The comparison of the partial and saturation pressure distributions provides hint directly related to answering the questions if there is quantitative risk of condensation within the construction or not.
All areas at which partial pressure of vapour is higher then the saturation pressure can be accounted as endangered and can be visualized as such graphically (e.g..shown as false colours, or as isosurface or an isoline at the zero value of the difference of vapour pressures or one specific value of relative interstitial core humidity).
| Example: Vapour pressure difference and vapour diffusion streams |
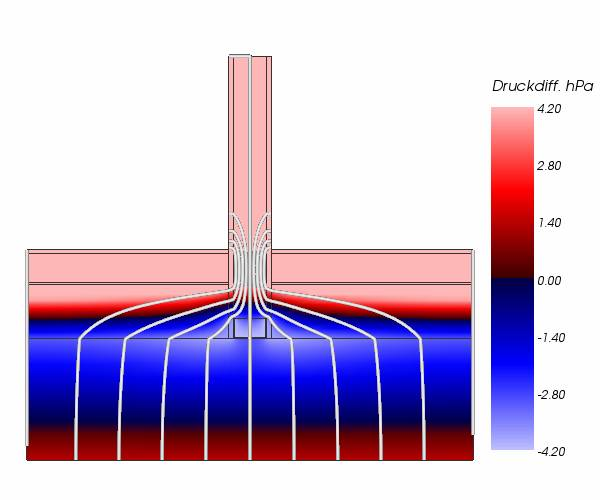 |
| This humidity model calculation shows, due to the cold
bridge effect caused by a partition wall of stud framing gypsum plaster
placed directly onto the slab on the one hand, and - due to the interruption
of the moisture barrier on the war side, just below the heating pavement -
the possibility of diffusing water vapour into the floor structure through
the partition wall on the other, additional regions of higher condensation
risk. These are highly distinctive in the surrounding of the bottom
U-Profile of the partition wall. Legend:
|
Transposing this method used in AnTherm onto the commonly used Glaser-Method for one dimensional case means, that intersections of vapour partial pressure distribution with saturation pressure distribution are calculated and regions within this intersections are interpreted as condensation risk areas. It is well known that the width of such zones is mostly overestimated.
It has to be accounted, that when interpreting such results, diffusion is not the only driving factor for vapour transport. Especially within massive constructions water and vapour transport can be significantly influenced by capillary transport hence diffusion might be less significant then.
The implementation provided in AnTherm shall be mainly used for answering the question if, and if so where within the construction, by given boundary conditions (air temperature and relative air humidity) moisture is produced.
| Example: Vapour pressure difference and vapour diffusion streams |
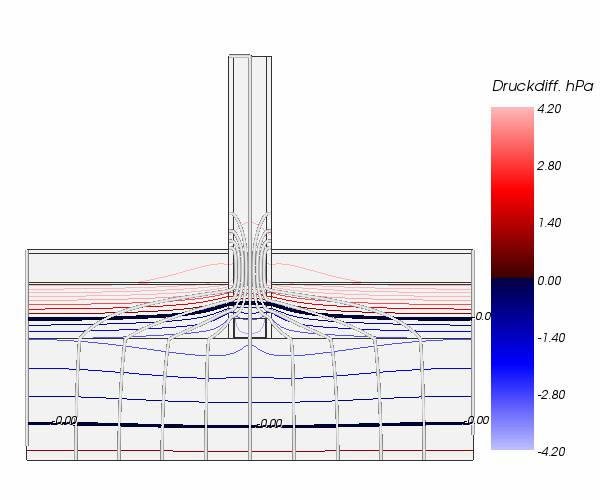 |
| This humidity model calculation shows, due to the cold bridge effect
caused by a partition wall of stud framing gypsum plaster placed directly
onto the slab on the one hand, and - due to the interruption of the moisture
barrier on the war side, just below the heating pavement - the possibility
of diffusing water vapour into the floor structure through the partition wall
on the other, additional regions of higher condensation risk. These are
highly distinctive in the surrounding of the bottom U-Profile of the
partition wall. Legend:
|
Remark: More exact estimation of condensation zones and moisture amounts is subject for future developments.
See also: Theoretical background, European standards on thermal bridges, EN ISO 13788
| Example: Distribution of the temperature and heat stream lines |
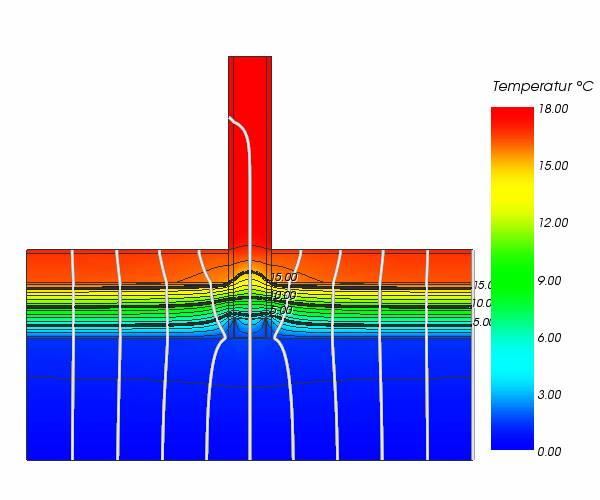 |
| Partition wall of stud framing gypsum plaster placed directly onto
the 30cm thick concrete ceiling above basement garage, without thermal
insulation on the cold side. The EPS heat insulation layer (Röfix 831, zementgebundene Polystyrolflocken) of 13,5 cm thickness has been placed solely on top of the concrete plaster - there is no other heat coating at the bottom side of the ceiling. The typical cross section of this ceiling construction has been assessed being not critical at all. Legend:
|
| Example: Heat flux distribution and heat stream lines |
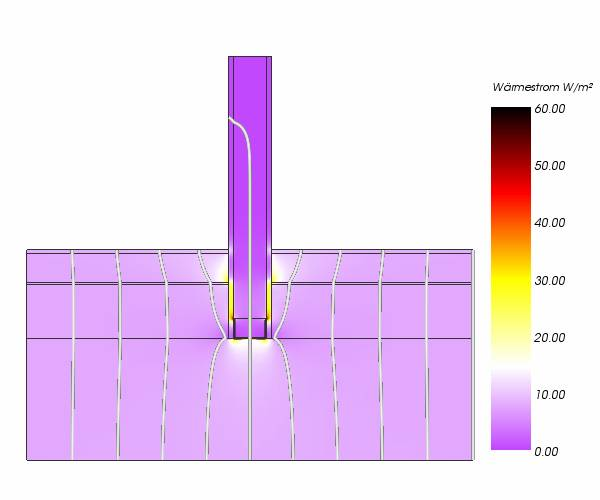 |
| Partition wall of stud framing gypsum plaster placed
directly onto the 30cm thick concrete ceiling above basement garage, without
thermal insulation on the cold side. The EPS heat insulation layer (Röfix 831, zementgebundene Polystyrolflocken) of 13,5 cm thickness has been placed solely on top of the concrete plaster - there is no other heat coating at the bottom side of the ceiling. The typical cross section of this ceiling construction has been assessed being not critical at all. Legend:
|