Profile  (control panel)
 The
control panel Profile defines parameters for the visualization of values
of the active function
along specified line or edge showing within X/Y-diagram.
The
control panel Profile defines parameters for the visualization of values
of the active function
along specified line or edge showing within X/Y-diagram.
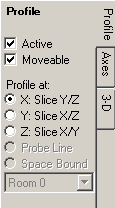
| Active | Decide about the visibility of the function diagram. |
| Moveable | If turned off all mouse events will be directed to the 3D evaluation - the diagram cannot be sized nor moved anymore. |
| Profile at: X:SliceY/Z Y:SliceX/Z Z:SliceX/Y |
Selects the line used to profile the values of the active
function. The location of the line is set by values controlled within panels Slice X, Y and Z. |
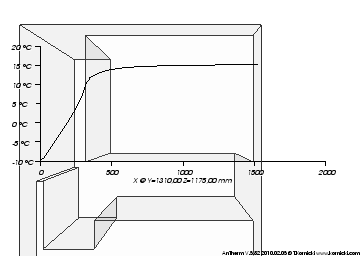
Labels of the horizontal axis display coordinate values along the chosen edge line. The axis title report the exact position and direction of the profile line.
The position at which the diagram is displayed can be arbitrarily changed within the 3D view by moving and sizing it with the mouse.
Remark: Adjustments of axis labels can be done within panel Axes.
The colour of the function line, axes lines and annotations is chosen automatically and set to some high contrast colour against current background colour.
Remark: Settings "Probe Line" and "Space Boundary" are yet inactive within current implementation.
Position and size of the diagram display
The position at which the diagram is displayed can be arbitrarily changed within the 3D view by moving and sizing it with the mouse if the "Moveable" setting is turned on.
You interactively manipulate the position, size, and orientation of the
diagram. It reacts to to left mouse events and mouse movement. The shape of the
cursor will change based on its location. If the cursor is over an edge of the
diagram the cursor shape will change to a resize edge shape.
If the position
of diagram is moved to be close to the centre of one of the four edges of
the 3D view, then the diagram will change its orientation to align with that
edge. This orientation is sticky in that it will stay at that orientation until
the position is moved close to the centre of another edge.
Actual position of the diagram is saved automatically within application settings file and restored the next time the Results3D window is opened.
Remark: If the case the diagram has been accidentally moved outside of the visible area of the window, it can not be picked with the mouse pointer anymore for any further movement. To restore the position to some position where it can be picked and moved again you must close the 3D window and reopen it - the diagram will be automatically restored at some visible position nearby the image edge.
See also: Results 3D window, Slice X, Y, Z (control panels), Axes (control panel)