Probe  (control panel)
 The
control panel Probe is used to control the view of data measurement at
some probe point, graphical display of its location and control of additional
interactive positioning methods.
The
control panel Probe is used to control the view of data measurement at
some probe point, graphical display of its location and control of additional
interactive positioning methods.
The position of the probing point is defined by the intersection of the three slice planes Slice-X / Slice-Y / Slice-Z. Here it can be interactively moved by dragging the 3D cursor with the mouse or by picking points with the mouse at any displayed surface.
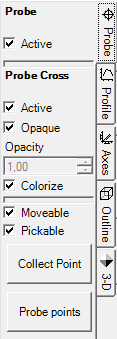
| Probe | |
| Active | Decides about the visibility of the probe data for its textual readout. |
Probe Cross |
|
| Active, Opaque, Colorize | Decide about the visibility, colorizing and transparency of the probe cross |
| Moveable | When active allows interactive moving of the 3D cursor (by dragging it with the mouse) and thus arbitrary placement of the probe point position X,Y,Z. |
| Pickable | When active allows picking the probe point position at any surface object displayed by clicking (or double clicking) on it. |
| Collect Point | Coordinates X,Y,Z of the current probe point are added to the
list of probe points (this
list will be edited within the
Probe Points window and
evaluated within
Probe Points part of Results report). The window Probe Points will be exposed also. |
| Probe points | The window Probe Points will be exposed. |
Readout of the probe point data
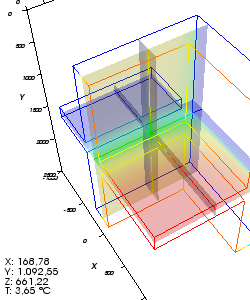
The result of this probing evaluation is shown at the bottom left corner of the view. The colour for that display is chosen automatically and set to some high contrast colour against current background colour.
At the evaluated point its coordinates are output (the values of X,Y and Z) along with the calculated value of temperature. If required tri-linear interpolation is used to calculate exact resultant value at any point of modelled construction from values calculated by the simulation at nodes of the super fine grid.
The probe provides the way to read out a value (e.g. temperature in °C) at any point of the construction.
If the probing point is placed at space boundary the value of non condensing
(maximum) air humidity (%) is evaluated and output also.
![]() If
there is solution of vapour diffusion available also, probing shows the pressure
difference of partial and saturation pressures (hPa) too.
If
there is solution of vapour diffusion available also, probing shows the pressure
difference of partial and saturation pressures (hPa) too.
If the point is positioned at the exterior of modelled construction no results
are output beyond coordinate data.
Remark: The Probe Points part of Results report provides an alternative textual method of evaluating temperature values at multiple probe points .
Visualizing the probe point location
At the intersection lines of slice planes X,Y,Z a colorized probe cross can be displayed. Actual colorizing follows the values of active function (temperature, heat flux (stream density), etc. - selected within General control panel) and currently selected Colour table.
Remark: Because this evaluation provides reasonable
results for points located in model's interior only it is advisable to either
turn the view of the surface
completely off or show it partially transparent (i.e.
not opaque) or show it as
wireframe only.
The tooltip of the tab will show up if the surface
obscures objects rendered within the interior of the model.
Moving the probe point interactively (3D cursor moveable)
 The setting Moveable controls the 3D cursor. The
setting can have one of the three distinct states:
The setting Moveable controls the 3D cursor. The
setting can have one of the three distinct states:
| Checked | Immediate | 3D cursor is active. While the 3D cursor is being dragged with the mouse its position will be immediately applied to the values of Slice X,Y,Z thus resulting in frequent (interactive) updates of the rendering. |
| Partly checked | Deferred | 3D cursor is active. The new position of the 3D cursor will be passed to Slice X,Y,Z coordinates at the end of the move (i.e. when the mouse button is depressed). This ensures that the eventually complex visualisation pipeline is executed at final position once only. |
| Unchecked | Off | Using the 3D cursor is disabled. |
Interaction with the 3D cursor will start as soon as the mouse is positioned in the neighbourhood of the probe cross or rectangle lines surrounding the slice planes (so called X/Y/Z shadows) an the left mouse button is depressed. Elements of the 3D cursor will display in light green during the active interaction.
If the shift key is held depressed during the initial move of the 3D cursor, than that initial move direction constrains the further interaction to one axis direction only.
Remarks: The widget itself is shown nearly transparent not to overlap with other elements (opacity = 0.1). The outline shadow (the box) is not shown by design. When selected default colour used (light-green). Scaling/Zooming/Translation of the 3D cursor outline is not allowed by design. Movements are always constrained to the bounding box of the model.
Remark: During export operations the 3D cursor widget will be hidden temporarily and not rendered to the resulting export view.
Picking the probe point at surfaces shown (picakble)
 The setting Pickable controls the picking
behaviour of the mouse. The
setting can have one of the three distinct states:
The setting Pickable controls the picking
behaviour of the mouse. The
setting can have one of the three distinct states:
| Checked | Double Click | Picking a point on some visible surface is initiated with a double click. |
| Partly checked | Single Click | Picking a point on some visible surface is initiated with one single click. |
| Unchecked | Off | Picking is disabled. |
Upon the click (or double click) the application will attempt to pick the point on the next visible surface below the current cursor position.
The picking of the point is available at visible (i.e. active, opaque or partly transparent) surface objects and provided in that order:
- Surface - locating probe output at interesting places of the analyzed scalar function.
- Isosurface - usable to pick a starting point of streamline on the isosurface of high heat flux (identifying thermal bridges).
- Slices X,Y,Z - usable to re-position two slice planes at some location at the third plane
Remark: if neither surface object is visible (inactive or totally transparent) picking will have no effect.
Remark: The position of SliceX/Y/Z will be retained within application settings and restored respectively.
If the old slice position is outside of the model bounds (with model spatially changed or different model loaded) the respective
slice position will be reset to the centre of the model. See also
Application setting "Restore last Result3D Parameters".
Remark: From the Probe points window you can double click onto a data mark record of some point listed there to transfer its coordinates to the 3D evaluation (position of slices X/Y/Z) .
See also: Results 3D window, Active (setting), General (control panel), Active Function, Slice X,Y,Z (control panel), Surface (control panel), Profile (control panel), Probe Points window