Slice X, Y, Z (control panels)
 Control
panels Slice X, Slice Y, Slice Z are used to adjust parameters of slice
planes parallel to coordinate axes planes cutting through the construction.
These settings have impact onto result of evaluations focused onto slice planes
also:
Colorizing and Isolines (Isotherms).
The inputs are also used to control the
Probe evaluation, Profile
evaluation, Streamlines
evaluation and Vectors (HedgeHog, Arrows) evaluation.
Control
panels Slice X, Slice Y, Slice Z are used to adjust parameters of slice
planes parallel to coordinate axes planes cutting through the construction.
These settings have impact onto result of evaluations focused onto slice planes
also:
Colorizing and Isolines (Isotherms).
The inputs are also used to control the
Probe evaluation, Profile
evaluation, Streamlines
evaluation and Vectors (HedgeHog, Arrows) evaluation.
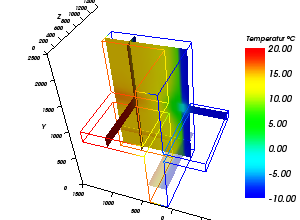
Slice planes are shown colorized. Actual colorizing follows the values of active function (temperature, heat flux (stream density), etc. - selected within General control panel) and currently selected Colour table.
Crossing lines of the three slice planes (these lines are parallel to the axes) can be also shown (controlled via Probe panel). That other panel provides additional control of interactive moving the cross point.
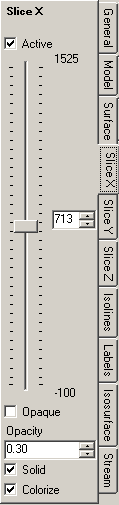
| Active, Opaque, Colorize | Decide about the visibility, colorizing and transparency of the slice |
| Value | The slice position is defined by an input of plane
coordinate (x for slice-X, y for slice-Y or z for slice-Z). The input can be performed either by
|
| Context menu/ Coordinate list |
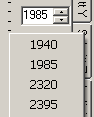 The
context menu of this control panel offers the list of all surface coordinates within the modelled construction (in the direction of respective axis). The
context menu of this control panel offers the list of all surface coordinates within the modelled construction (in the direction of respective axis).By choosing one of the values the position of the slice plane will be set accordingly. |
Remark: Because slice plane intersects with model's interior only it
is advisable to either turn the view of the surface
completely off or show it partially transparent (i.e.
not opaque) or show it as
wireframe only.
The tooltip of the tab will show up if the surface
obscures objects rendered within the interior of the model.
Remark: The slice planes (SliceX, SliceY, SliceZ, orthogonal to respective coordinate axis) show plane intersections with construction colorized by values of selected function. If required values are interpolated (linear interpolation). Slices are shown partially transparent (according to current opacity value). To receive opaque representation (non transparent) use the switch Opaque.
Remark: Slice edges (these are placed at construction's surface) are shown to emphasize the position of the slice plane even if the slice itslf is transparent and not visible. The exposure of slice edges can be controlled from the control panel Surface.
Remark: The position of SliceX/Y/Z will be retained within application settings and restored respectively.
If the old slice position is outside of the model bounds (with model spatially changed or different model loaded) the respective
slice position will be reset to the centre of the model. See also
Application setting "Restore last Result3D Parameters".
Remark: A double click onto the data record mark of a line corresponding to a probe point within the probe points window will initiate the transition of the position of the probe point currently shown within Results3D window to coordinates shown in the respective line – slice planes X/Y/Z are moved accordingly. Within a 2D project slice plane Z is moved to 500 mm.
See also: Results 3D window, Active (setting), Opaque and Opacity (setting), Colorize (setting), Solid or Wireframe (setting), General (control panel), Active Function, Isolines (Isotherms), Probe (control panel)